Instead of me F5'ing my stock portfolio app, I wanted to have an unobtrusive indicator to show how well my stocks were doing. Therefore I started building this small project consisting of an RGB LED and an ESP-01. It's a really simple setup, but it does the job well! The RGB's brightness represents the percentual change of the stock's price compared to the previous close.
Hardware
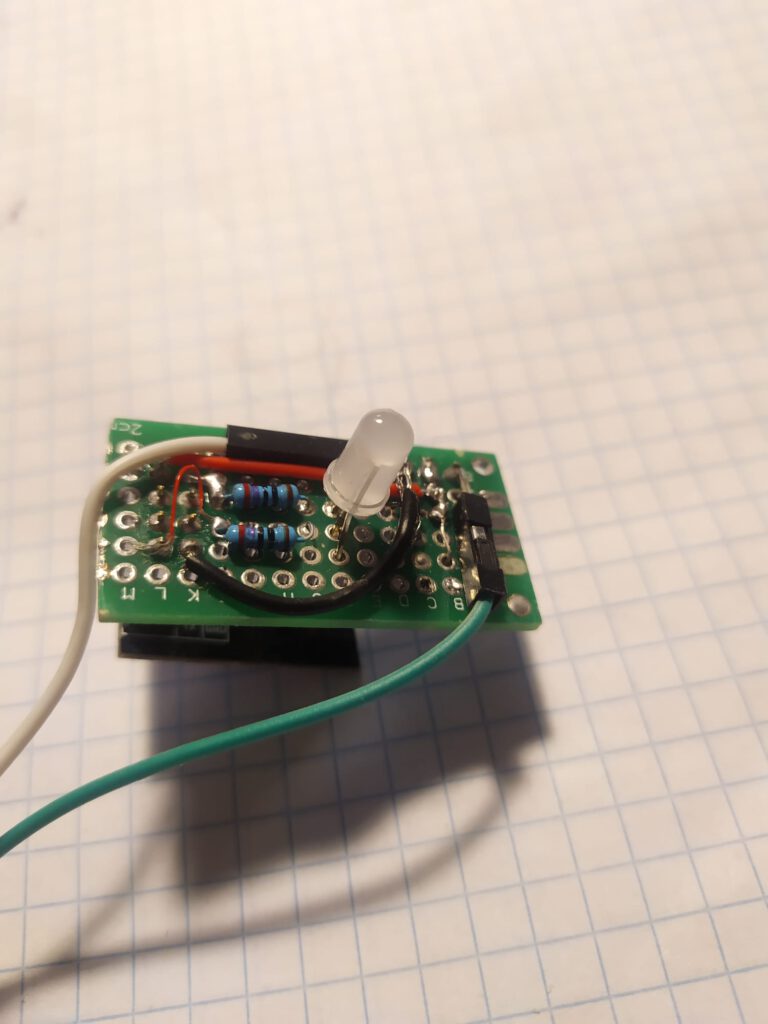
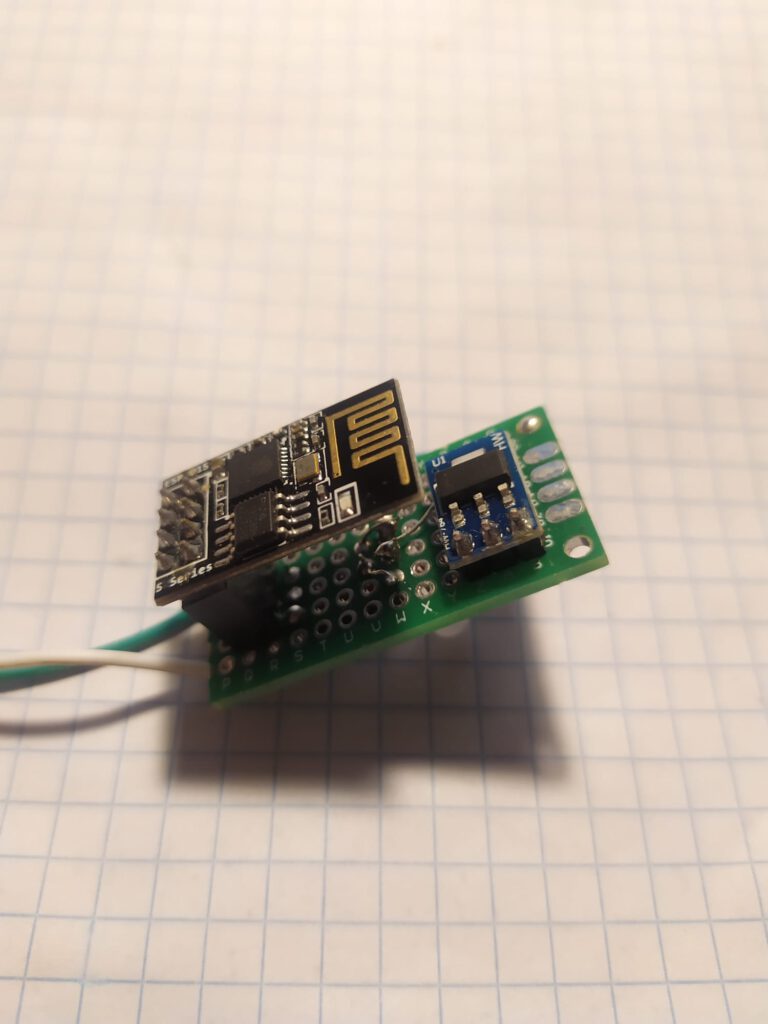
I used the following components:
- ESP-01s
- RGB LED
- 5V to 3.3V Step Down Module
- 3x2 Female Headers
- 2x 220Ω resistor
- Micro USB breakout
- A perf board
- Wires
The circuit is very simple: hook the common anode up to 3.3V. The Red and Green pins should be connected in series with a resistor to one of the GPIO's, I chose TX/RX (note that GPIO2 is connected to the onboard LED). Finally connect 3.3V and GND to 5V / GND from the step down module. I added a micro USB breakout to be able to conveniently hook the device up to a phone charger.
The result looks like this:
Software
Brightness
Using the analogWrite() function, a PWM signal is sent to a pin emulating an analog value. The range goes from 0 (off) to 255 (fully bright). I picked -2.0% to +2.0% to be the corresponding percentages to (0, 255). That is, the red light will be fully bright at a 2% loss. At 0%, both the red and the green light will be off.
The human perception of brightness of an LED tends to be exponential rather than linear. That means we cannot just multiply the percentage with 255. Instead, I used the following function:
with x the step of the fade, y the analog value (0 - 255), and r a constant based on the number of steps and the required output. See this blogpost for a more detailed explanation.
To represent the values of both the red and green LED in a single int, I let it range from (-255, 255).
Fading animations
Instead of the LED jumping to different levels of brightness, I wanted it to transition smoothly. Therefore I implemented a fade animation. Because I try to stay away as much as possible from the blocking delay() function, I used the Ticker library. If we want to transition from value to newValue (e.g. -100 to 30), we add up 1 to the value until we reach 30. At the tipping point (0) we switch from PIN_RED to PIN_GREEN. Note that in the following function I substract the brightness from 255, because my RGB LED's share a common anode.
void fadeAnimation(){

  value += (newValue > value) ? 1 : -1;

  int brightness = 255 - (pow (2, (abs(value) / R)) - 1);
  analogWrite(value >= 0 ? PIN_GREEN : PIN_RED, brightness);

  if (value == 0)
    analogWrite(PIN_RED, 255);

  if (value == newValue)
    ticker.detach();
}
After I set the global variables value and newValue, I can run the animation by attaching it with a certain interval (20 ms):
ticker.attach_ms(20, fadeAnimation);Similarly, other animations can be built (for more examples, see another blogpost). If the total gain (or loss) exceeds an arbitrarily large percentage (I chose ±2.0%), the LED starts a faded blink, ranging from (150, 255). The blinking animation is implemented as follows. The global booleans inc and gain refer to whether the brightness is going up or down and if it is a loss or a gain respectively.
void blinkAnimation(){

  value += incr ? 1 : -1;
  int x = gain ? 1 : -1;

  if (value == MIN_BLINK * x || value == 255 * x)
    incr = !incr;

  int brightness = 255 - (pow (2, (abs(value) / R)) - 1);
  analogWrite(gain ? PIN_GREEN : PIN_RED, brightness);
}
Getting stock data
The device gets its input over MQTT. It accepts integers between (-255, 255) to apply regular fading. The blinking animation starts whenever the input is larger than 255 or less than -255 (big gains or big loss).
The input is generated by a script in Node-RED, running on my local server. It retrieves the daily percentual change and the last closing price from CNBC. The input is your portfolio, i.e. the amount of different stocks you own. For example (this is not financial advice):
{
    "GME": 100,
    "AMC": 120,
    "SPY": 10
}
The scripts calculates the sum of the current values (price * shares) and the sum of the values of the last closing position, and subsequently calculates the percentual difference. This is multiplied by 255, which is sent to the device. If the percentage is ±2.0%, then ±256 is sent to initiate the blinking effect.
The script repeats this every 5 minutes from Monday - Friday between 9:00 and 18:00. It sends "0" from Tuesday - Saturday at midnight to start each day with 0%.
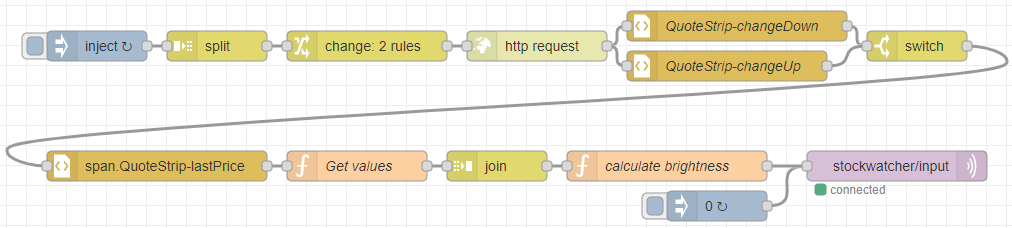
[{"id":"674ace61965dd6f3","type":"tab","label":"StockWatcher","disabled":false,"info":""},{"id":"a3965a6d1f028337","type":"mqtt out","z":"674ace61965dd6f3","name":"","topic":"stockwatcher/input","qos":"","retain":"true","respTopic":"","contentType":"","userProps":"","correl":"","expiry":"","broker":"91478dbd.3a542","x":1050,"y":300,"wires":[]},{"id":"51461b585fb7f860","type":"inject","z":"674ace61965dd6f3","name":"","props":[{"p":"payload"},{"p":"topic","vt":"str"}],"repeat":"","crontab":"*/5 9-17 * * 1,2,3,4,5","once":false,"onceDelay":0.1,"topic":"","payload":"{\"VWCE-DE\":118,\"EUNL-DE\":135,\"2B76-DE\":200}","payloadType":"json","x":250,"y":180,"wires":[["4e27710d586f6e32"]]},{"id":"7079c3cc9310472a","type":"inject","z":"674ace61965dd6f3","name":"","props":[{"p":"payload"},{"p":"topic","vt":"str"}],"repeat":"","crontab":"00 00 * * 2,3,4,5,6","once":false,"onceDelay":0.1,"topic":"","payload":"0","payloadType":"str","x":870,"y":340,"wires":[["a3965a6d1f028337"]]},{"id":"a93c79c6d3463997","type":"http request","z":"674ace61965dd6f3","name":"","method":"GET","ret":"txt","paytoqs":"ignore","url":"","tls":"","persist":false,"proxy":"","authType":"","x":690,"y":180,"wires":[["ecab29e24342226f","dcb15801c4ba12bd"]]},{"id":"53c198a183756082","type":"function","z":"674ace61965dd6f3","name":"Get values","func":"\nvar re = /-?\\d+.\\d+/\nchange = msg.change[1].match(re)[0]; // eg -1.0 %\n\ncurrentValue = parseFloat(msg.price) * msg.shares;\nprevValue = msg.price * (1 - parseFloat(change) / 100) * msg.shares;\n\n\nmsg.payload = { \"currentValue\": currentValue,\n \"prevValue\": prevValue};\n\nreturn msg;","outputs":1,"noerr":0,"initialize":"","finalize":"","libs":[],"x":510,"y":300,"wires":[["7343537e9419cb97"]]},{"id":"4e27710d586f6e32","type":"split","z":"674ace61965dd6f3","name":"","splt":"\\n","spltType":"str","arraySplt":1,"arraySpltType":"len","stream":false,"addname":"stock","x":370,"y":180,"wires":[["c3b86f27573d40b6"]]},{"id":"c3b86f27573d40b6","type":"change","z":"674ace61965dd6f3","name":"","rules":[{"t":"set","p":"url","pt":"msg","to":"\"https://www.cnbc.com/quotes/\" & msg.stock","tot":"jsonata"},{"t":"set","p":"shares","pt":"msg","to":"payload","tot":"msg"}],"action":"","property":"","from":"","to":"","reg":false,"x":520,"y":180,"wires":[["a93c79c6d3463997"]]},{"id":"7343537e9419cb97","type":"join","z":"674ace61965dd6f3","name":"","mode":"auto","build":"object","property":"payload","propertyType":"msg","key":"topic","joiner":"\\n","joinerType":"str","accumulate":true,"timeout":"","count":"","reduceRight":false,"reduceExp":"","reduceInit":"","reduceInitType":"","reduceFixup":"","x":650,"y":300,"wires":[["f69243b4ecf15c8d"]]},{"id":"f69243b4ecf15c8d","type":"function","z":"674ace61965dd6f3","name":"calculate brightness","func":"const START_BLINKING = 2.0;\n\nresult = 0.0;\ncurrent = 0.0;\nprev = 0.0;\n\nfor (var stock in msg.payload){\n current += msg.payload[stock].currentValue;\n prev += msg.payload[stock].prevValue;\n}\n\nresult = (current - prev) / prev * 100;\n\nif (result > START_BLINKING)\n result = 256;\nelse if (result < - START_BLINKING)\n result = -256;\nelse\n // map 0 - 2.0 to 0 - 255\n result *= (255 / START_BLINKING) ;\n\n\nmsg.payload = Math.round(result);\nreturn msg;","outputs":1,"noerr":0,"initialize":"","finalize":"","libs":[],"x":820,"y":300,"wires":[["a3965a6d1f028337"]]},{"id":"ecab29e24342226f","type":"html","z":"674ace61965dd6f3","name":"QuoteStrip-changeDown","property":"payload","outproperty":"change","tag":"span.QuoteStrip-changeDown>span","ret":"html","as":"single","x":890,"y":160,"wires":[["c85d09b518534e1e"]]},{"id":"c85d09b518534e1e","type":"switch","z":"674ace61965dd6f3","name":"","property":"change","propertyType":"msg","rules":[{"t":"nempty"}],"checkall":"true","repair":false,"outputs":1,"x":1070,"y":180,"wires":[["1260210f42e1a1a5"]]},{"id":"dcb15801c4ba12bd","type":"html","z":"674ace61965dd6f3","name":"QuoteStrip-changeUp","property":"payload","outproperty":"change","tag":"span.QuoteStrip-changeUp>span","ret":"html","as":"single","x":880,"y":200,"wires":[["c85d09b518534e1e"]]},{"id":"1260210f42e1a1a5","type":"html","z":"674ace61965dd6f3","name":"","property":"payload","outproperty":"price","tag":"span.QuoteStrip-lastPrice","ret":"html","as":"single","x":310,"y":300,"wires":[["53c198a183756082"]]},{"id":"91478dbd.3a542","type":"mqtt-broker","name":"","broker":"mqtt.joszuijderwijk.nl","port":"8883","tls":"","clientid":"server_berenhuis","usetls":true,"compatmode":false,"protocolVersion":"4","keepalive":"60","cleansession":true,"birthTopic":"","birthQos":"0","birthPayload":"","birthMsg":{},"closeTopic":"","closeQos":"0","closePayload":"","closeMsg":{},"willTopic":"","willQos":"0","willPayload":"","willMsg":{},"sessionExpiry":""}]You can view the full code here.
Result
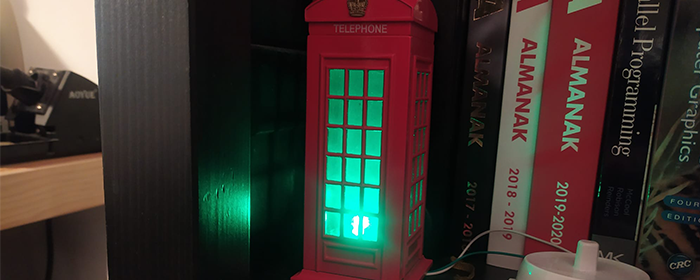
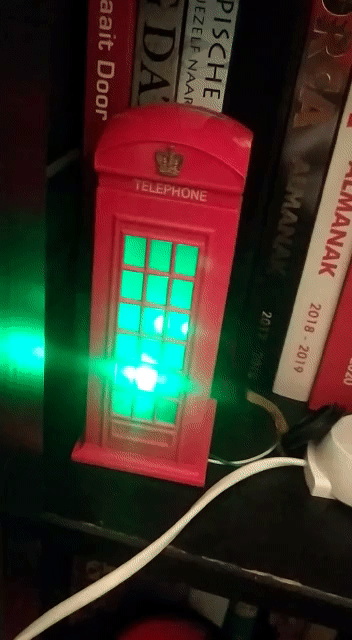
I inserted the device into a miniature English phone cell money box I had lying around. You can see the result below.

Gauge
Another nice way of displaying stock data could be a simple voltmeter (like this one).